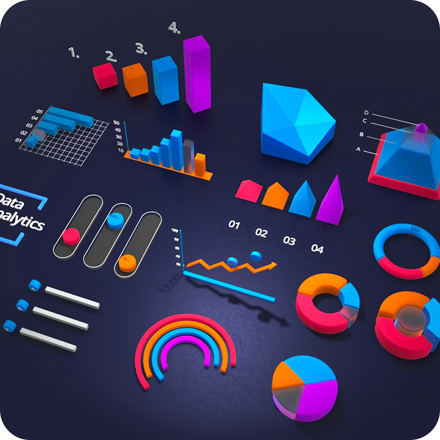
Reporting, Charts & Data Visualisation

Reporting, Charts & Data Visualisation

Custom reporting systems with interactive charts, KPIs, and dashboards that convert raw data into actionable insights. Exploding Phone designs visualisations that help businesses monitor performance, identify trends, and make data-driven decisions. Solutions are tailored for usability, scalability, and integration with existing data sources.

Get in touch for a quote

Need more information? Take a look at our Frequently Asked Questions Guide. Happy to take the next step? Call us or use the contact form to schedule a project feasibility chat. We will provide candid feedback on the match between your requirement and our skill set and, if there is a match, we will quickly provide you with indicative costings.

Get in Touch